Claude Skills for Data Scientists: Essential Tools for Analysis Workflows
Discover the best Claude Skills for data scientists in 2026. From CSV analysis and interactive dashboards to D3.js visualizations and scientific research workflows, these skills accelerate every stage of analysis.

Data scientists spend a significant portion of their working hours on tasks that are methodologically well-understood but time-consuming to execute: loading and profiling datasets, writing boilerplate visualization code, structuring literature reviews, and producing readable reports. Claude Skills can take on these mechanical steps, letting you spend more time on the parts of analysis that require genuine expertise.
This guide covers the most valuable Claude Skills for data science workflows in 2026 — from fast CSV profiling and interactive dashboards to scientific research support and AI agent debugging. Each skill is available on Claude Skills Hub and runs inside Claude Code.
Why Data Scientists Are Turning to Claude Skills
A Claude Skill is a SKILL.md file that gives Claude a specialized methodology for a particular task. When you install a data science skill, Claude does not just know that pandas exists — it knows how to use it in a structured way that produces reproducible, well-commented results consistent with your project's conventions.
The difference between using Claude without skills and using Claude with skills is the difference between asking a generalist for help and working with someone who already knows your stack and your standards.
Skills also compound. A typical analysis might invoke CSV Data Summarizer to profile a new dataset, Dashboard Creator to produce an executive-ready view, and D3.js Visualization to build a publication-quality chart — all in a single Claude Code session, each skill contributing its specialized knowledge to a coherent output.
CSV Data Summarizer
Skill: CSV Data Summarizer | Stars: 233
For any data scientist, the first thirty minutes with a new dataset are always the same: load it, check the shape, look at data types, scan for nulls, produce summary statistics, and form an initial hypothesis about data quality issues. CSV Data Summarizer automates this entirely.
The skill:
- Generates summary statistics (mean, median, std, min, max, percentiles) for numeric columns
- Detects missing data patterns and suggests imputation strategies
- Identifies likely data type mismatches (e.g., dates stored as strings, numeric IDs stored as floats)
- Produces quick visualizations: distribution histograms, correlation heatmap, missing data matrix
- Outputs a structured profiling report you can include in a project notebook
Example interaction:
/csv-data-summarizer

I just received a CSV file from a client: sales_data_q1_2026.csv
Run a full profile. Flag any quality issues that would affect a revenue forecasting model.
Claude will read the file, execute a pandas-based profiling script, interpret the results, and produce a written summary of data quality issues with severity ratings and recommended remediation steps.
This skill eliminates the copy-paste overhead of writing the same EDA boilerplate for every new project. You get a consistent, thorough profile every time.
Dashboard Creator
Skill: Dashboard Creator | Stars: 350
Once you have cleaned and analyzed data, the next challenge is communicating findings to stakeholders who are not going to read a Jupyter notebook. Dashboard Creator generates self-contained, interactive HTML dashboards from your data — no JavaScript framework knowledge required.
Capabilities:
- KPI metric cards with trend indicators
- SVG charts: bar charts, pie charts, line charts, and area charts
- Progress indicators and gauge visualizations
- Sortable and filterable data tables
- Semantic color coding based on thresholds you define
- Fully self-contained HTML output (no external CDN dependencies)
Example interaction:
/dashboard-creator

I have monthly sales data for 12 product lines over the past year.
Key metrics: total revenue, units sold, return rate, margin %.
Build a dashboard for a VP who wants to spot underperforming product lines at a glance.
Claude will generate a complete HTML file with organized sections, color-coded KPI cards highlighting products above or below target, and a sortable table for detailed comparison.
This is particularly valuable for data scientists embedded in business teams, where the ability to deliver a polished, shareable artifact quickly matters as much as the underlying analysis.
D3.js Visualization
Skill: D3.js Visualization | Stars: 110
D3.js is the standard library for publication-quality, custom data visualizations on the web — but its learning curve is steep. The D3.js Visualization skill gives Claude the depth of knowledge needed to produce non-trivial D3 charts without you needing to remember the D3 API.
This skill is the right tool when:
- You need a chart type not available in Plotly, matplotlib, or seaborn (network graphs, chord diagrams, treemaps, force-directed layouts, custom geographic projections)
- You are building a visualization for embedding in a web application or report
- You want full control over every visual element — axes, tooltips, transitions, colors, typography
Example interaction:
/d3-js-visualization

I have a dataset of 50 software dependencies with bidirectional relationships.
I need a force-directed graph where node size = number of dependents,
edge thickness = coupling strength. Output a self-contained HTML file.
Claude will produce a complete, working D3.js implementation with interactive zoom, drag-to-reposition nodes, and hover tooltips displaying dependency details.
For researchers preparing figures for publication or data scientists building portfolio pieces, D3.js Visualization bridges the gap between knowing what you want and knowing how to implement it.
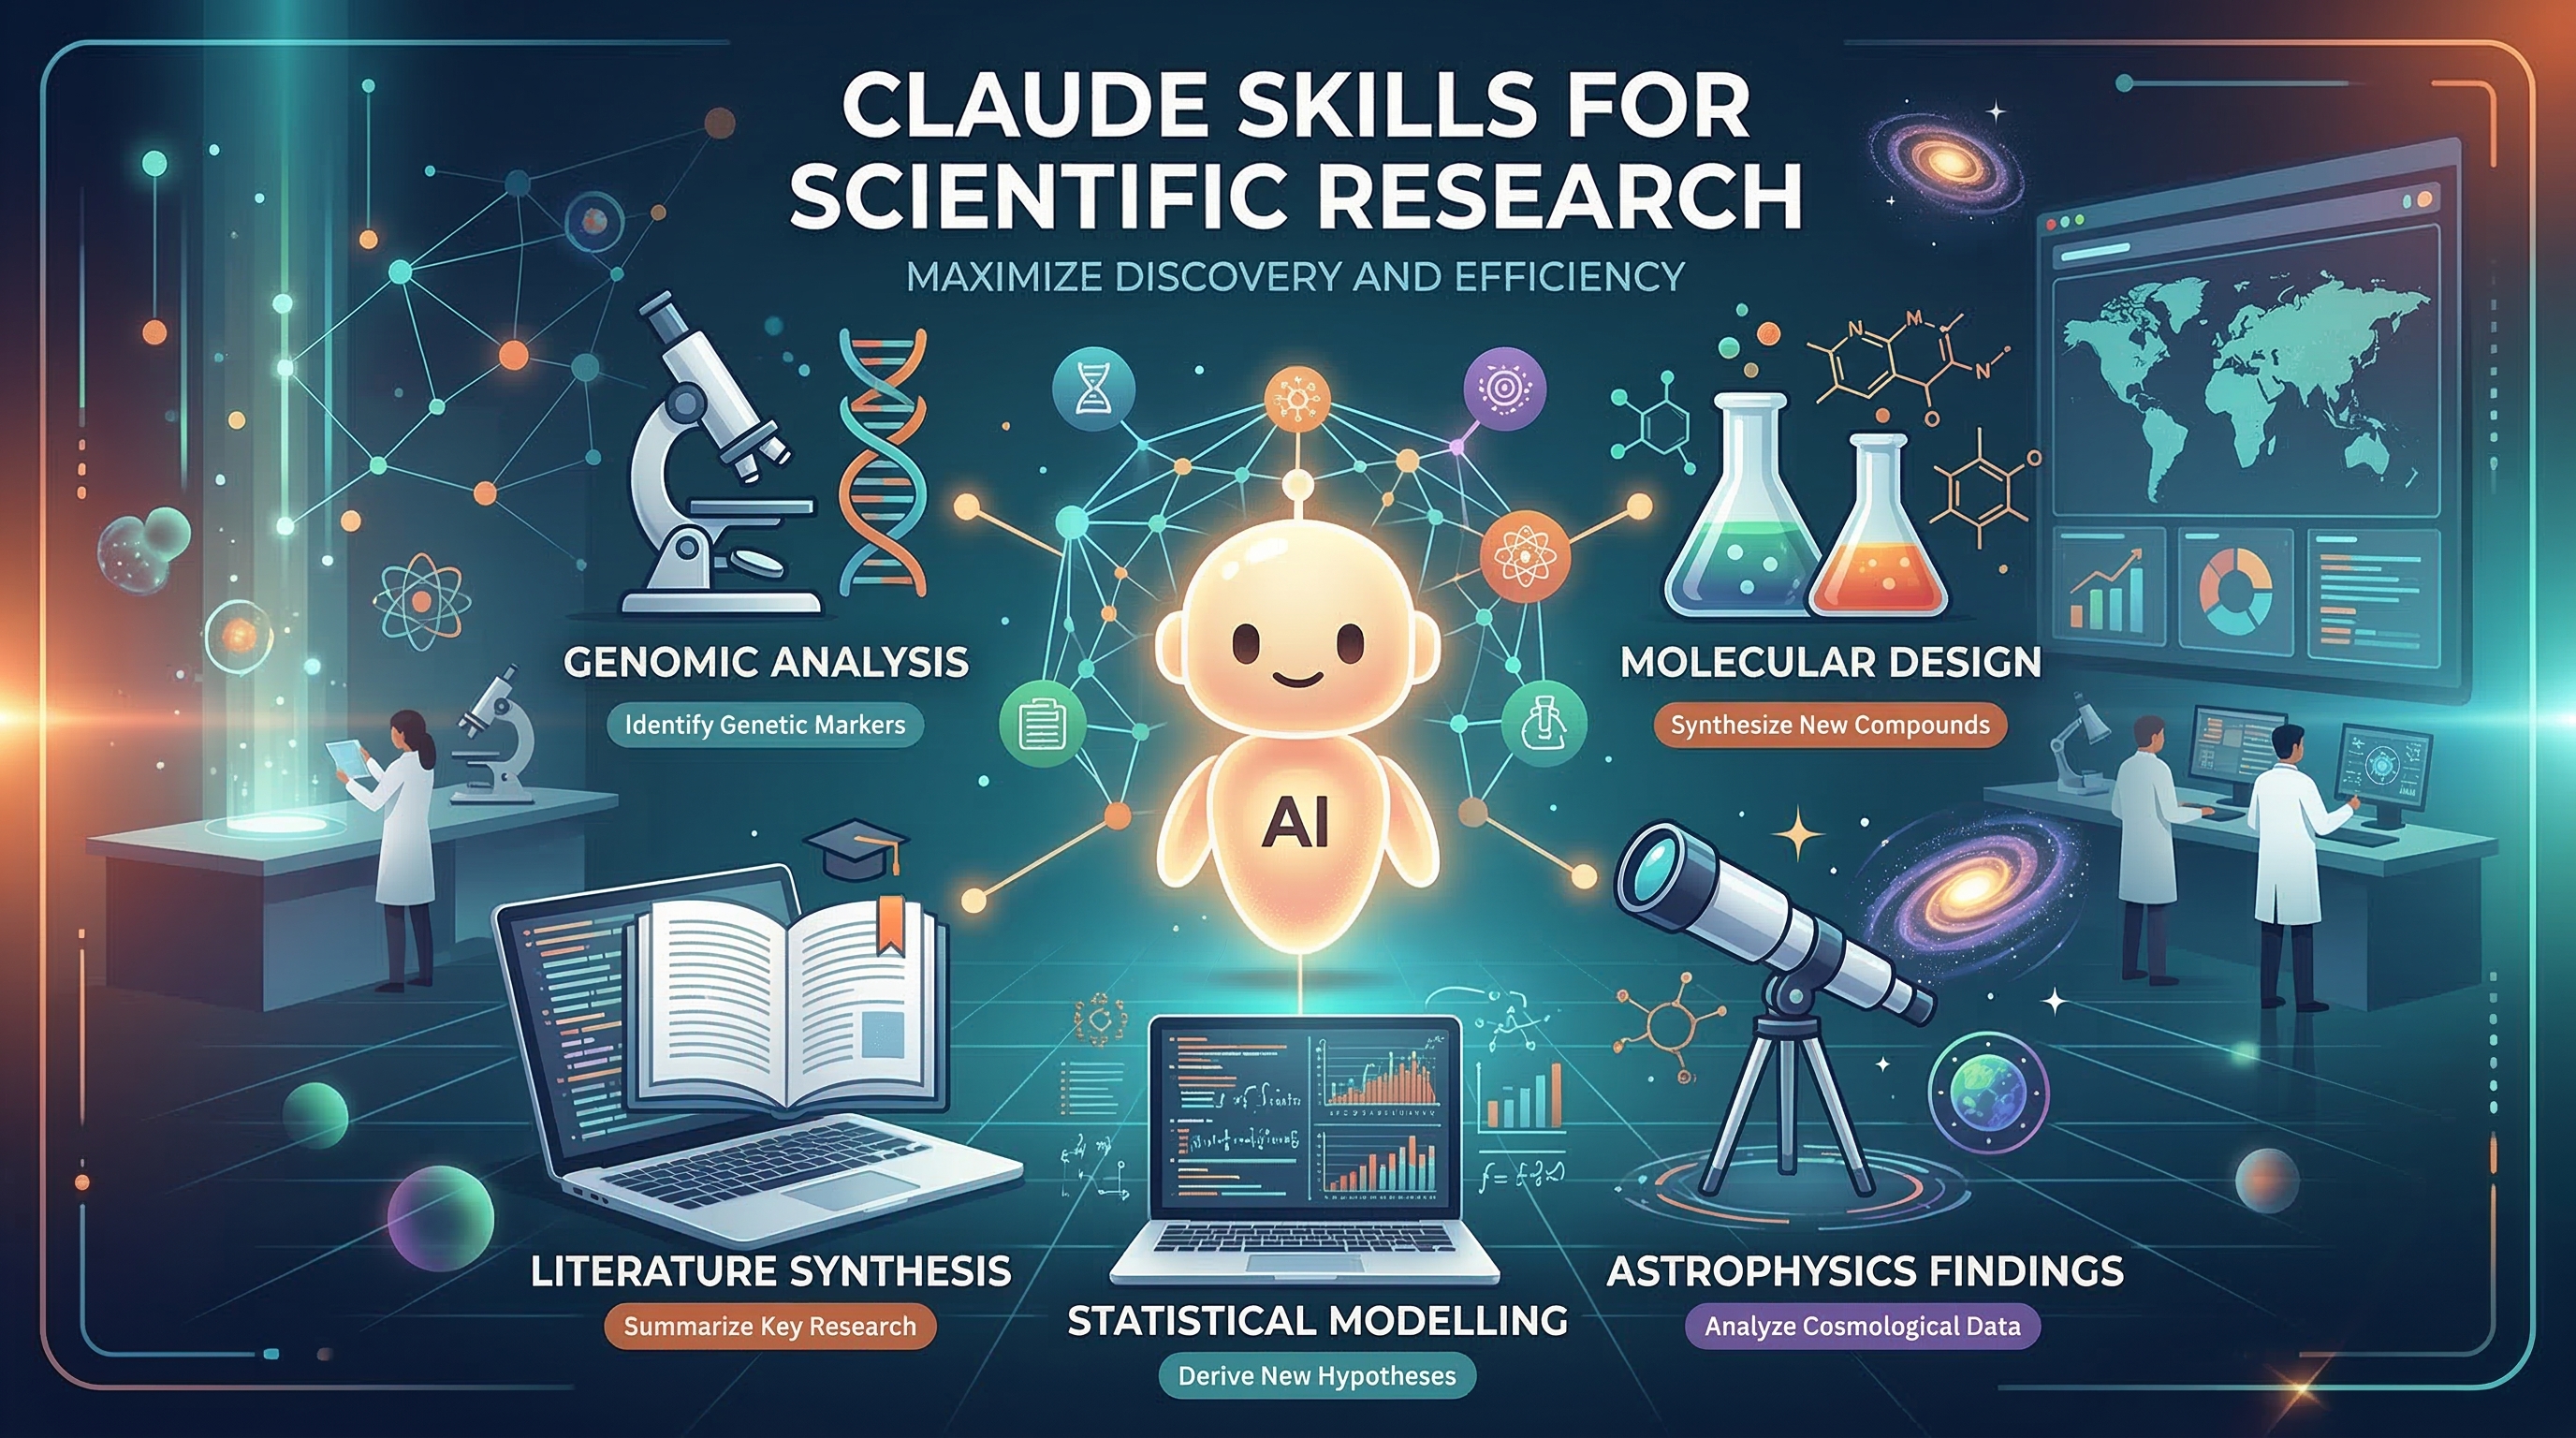
Scientific Thinking & Analysis
Skill: Scientific Thinking & Analysis | Stars: 450
This is the most comprehensive data science skill in the hub. It is designed for researchers who need end-to-end support across the full scientific workflow, not just the coding portions.
The skill covers:
- Exploratory Data Analysis — structured EDA with pattern identification and anomaly flagging
- Hypothesis Generation — first-principles reasoning to generate testable hypotheses from observations
- Literature Review — structured synthesis of research papers with gap identification
- Peer Review — critical analysis of methodology, statistical approach, and conclusion validity
- Scientific Brainstorming — structured ideation for experimental design
- Critical Thinking — assumption auditing and alternative explanation generation
- Statistical Analysis — test selection, assumption checking, effect size reporting
- Visualization — figure design guidance for research publications
- Writing — abstract, methods, and results section drafting
- Document Processing — analysis of DOCX, PDF, PPTX, and XLSX research documents
This skill is particularly well suited to graduate researchers, research engineers, and data scientists working in regulated industries where methodological rigor is documented and reviewed.
Example workflow:
/scientific-thinking-skills

I have 18 months of sensor data from a manufacturing process.
Observation: defect rate spikes correlate with shifts starting at 6am on Mondays.
Walk me through hypothesis generation and experimental design to investigate the cause.
Claude will guide you through a structured reasoning process: generating competing hypotheses (operator fatigue, equipment warm-up, supply chain patterns, measurement artifacts), designing discriminating experiments for each, identifying required data, and flagging confounders.
LangSmith Fetch (For ML Engineers Building Agents)
Skill: LangSmith Fetch | Stars: 3,200
For data scientists and ML engineers who build and evaluate AI systems using LangChain or LangGraph, debugging agent behavior is a significant ongoing challenge. Agents fail in subtle, non-deterministic ways that are hard to reproduce and harder to explain. LangSmith Fetch integrates Claude directly with LangSmith Studio for trace analysis.
The skill provides four workflows:
- Quick Debug — fetch and interpret the last N traces for a named chain or agent
- Deep Dive — step-by-step trace analysis with token usage, latency breakdown, and intermediate outputs
- Export — pull traces into structured JSON for offline analysis or reporting
- Error Pattern Detection — analyze a batch of failed traces to identify recurring failure modes
Example interaction:
/langsmith-fetch

My retrieval-augmented generation pipeline has a 23% hallucination rate on domain-specific queries.
Fetch the last 50 failed traces and identify the most common failure patterns.
Claude will connect to LangSmith, retrieve the traces, parse the intermediate steps, and produce a ranked list of failure patterns — for example, "retriever returns irrelevant chunks when query contains technical acronyms" — with specific trace IDs you can examine further.
This skill is most valuable for teams running evaluation loops who need to quickly interpret why a model change improved or degraded performance on a test set.
Conversation Analyzer (Improving Your Own Claude Usage)
Skill: Conversation Analyzer | Stars: 350
This skill is a meta-skill for data scientists who use Claude Code heavily. It analyzes your own Claude Code conversation history to surface usage patterns, common mistakes, and opportunities for workflow improvement.
What it identifies:
- Tasks you repeatedly ask Claude to do from scratch (candidates for skill creation)
- Common errors in your prompts that lead to back-and-forth correction
- Time-heavy workflows that could be partially automated
- Knowledge gaps that keep surfacing across sessions
Example interaction:
/conversation-analyzer

Analyze my last 30 days of Claude Code conversations.
Identify the top 5 repetitive tasks where I could save the most time with a custom skill.
Claude will parse conversation logs, aggregate task patterns, and produce a prioritized list of automation opportunities — essentially a productivity audit of your AI-assisted workflow.
For data scientists who use Claude Code daily, this skill often surfaces obvious wins: a data loading template that is rewritten from scratch every project, a specific error pattern that is caught at commit time every sprint, or a report formatting block that could be encoded in a skill once and reused indefinitely.
Building an End-to-End Analysis Workflow
Here is how these skills fit together across a typical analysis project lifecycle:
Phase 1: Data Acquisition and Profiling
  /csv-data-summarizer → Profile new datasets, identify quality issues

Phase 2: Hypothesis Development (for research contexts)
  /scientific-thinking-skills → Generate and refine hypotheses from observations

Phase 3: Analysis and Visualization
  /d3-js-visualization → Build custom, publication-quality charts
  /dashboard-creator → Produce stakeholder-ready interactive dashboards

Phase 4: Model and Agent Evaluation (for ML projects)
  /langsmith-fetch → Debug LangChain/LangGraph agent traces and failure patterns

Phase 5: Continuous Improvement
  /conversation-analyzer → Audit your own Claude usage and identify automation opportunities
Each skill is independent; you can adopt any subset based on your current project needs.
Installing Data Science Skills
All of these skills are available on Claude Skills Hub. Installation is the same for all skills:
- Visit the skill's page on Claude Skills Hub and download the
SKILL.mdfile - In your project directory, create
.claude/skills/if it does not already exist - Copy the
SKILL.mdfile into.claude/skills/ - Open Claude Code in your project
- Invoke the skill by typing its name prefixed with
/(e.g.,/csv-data-summarizer)
For skills that generate Python code (CSV Data Summarizer, Scientific Thinking), Claude Code's code execution environment will run the code directly. For skills that produce HTML output (Dashboard Creator, D3.js Visualization), the output file will be saved to your working directory.
What to Expect Next
The data science skills ecosystem on Claude Skills Hub is expanding rapidly. Skills under active development by the community include time series forecasting assistants, Bayesian inference guides, and statistical test selection frameworks.
The pattern across all of these tools is the same: encode methodological knowledge once in a SKILL.md file and stop re-explaining it from scratch every session. Your energy goes to interpretation and decision-making; Claude handles the structured execution.
Browse the full catalog at claudeskills.info and start building the data science skill stack that fits your workflow.